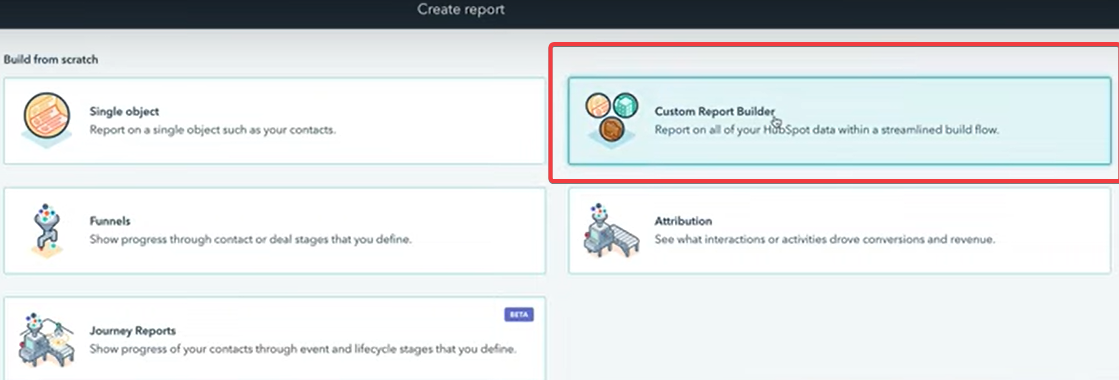
Creating the simplest custom report - a simple bar chart of contacts created per month.
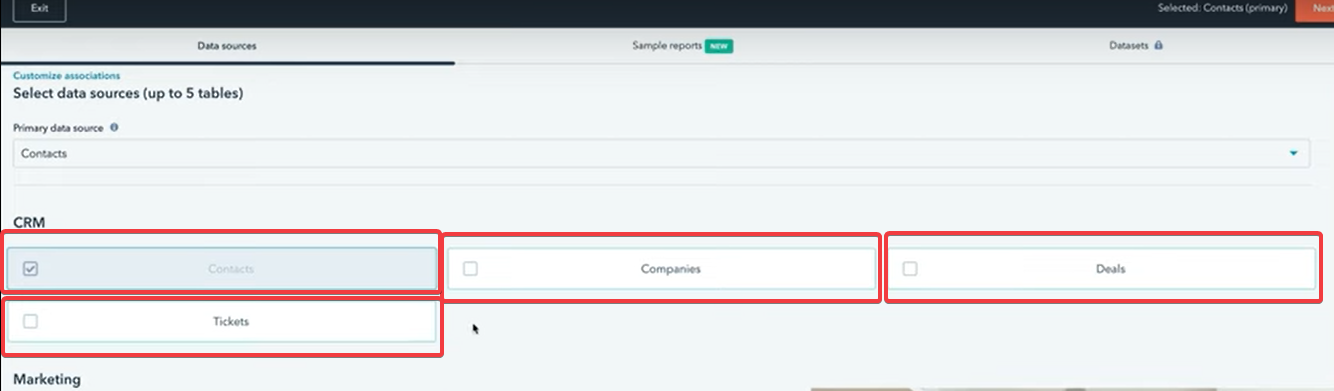
You can join across objects e.g. Contacts and Companies or Contacts and Deals and choose different properties.
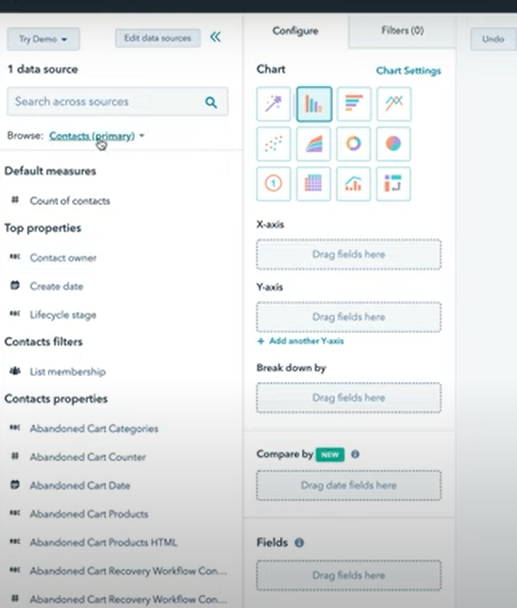
You can choose the different properties you want to include in your report here:
Here is a short video on how to get started with using the custom report builder:
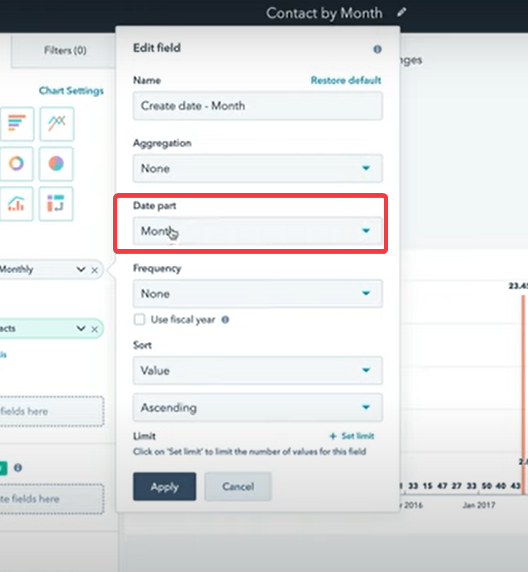
You can also use a new feature in HubSpot Custom Reports which is the Date Part:
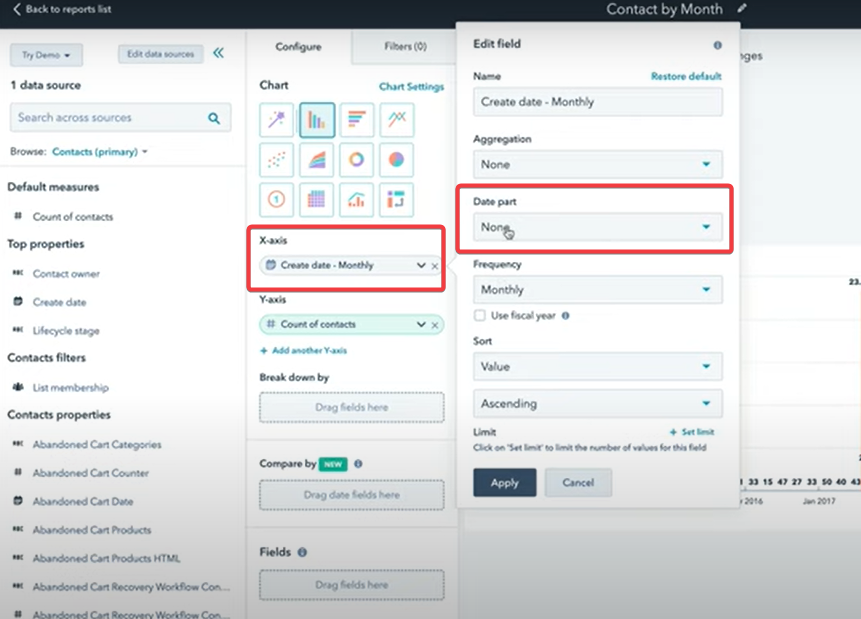
What this means is you can switch from seeing the frequency over all time to grouping it by date parts. A date part might be the month which can be used when you want to see seasonality trends.
Set Date Part to Month:
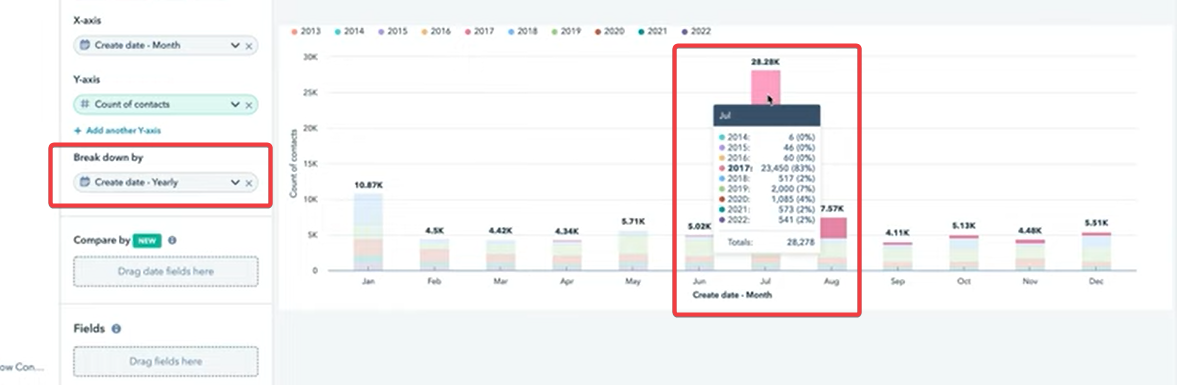
Here is the resulting report - data shown per month:

Check out this short video for more details on how to do this:
We can also break down data by other properties e.g. for a specific performing month (after using Date Part) use 'Break down by' and see the data broken down by Create date: Yearly.
You can check out a short video here on using break down by in HubSpot Custom Reports. This method can be used to create similar reports for Contacts, Deals, Tickets, and so on.