Accessing Dashboards:
- To access dashboards, navigate to the home page or go to "Reports" > "Dashboards."
- Users can view their current dashboard at the top left corner and access other dashboards from the drop-down menu
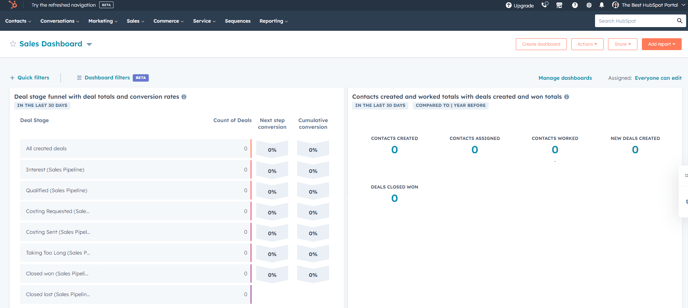
- Favorite dashboards for quick access by starring them, especially if you frequently refer to specific dashboards.
Creating Dashboards:
- Click on the "Create dashboard" button to begin.
- Choose between creating a dashboard from scratch or using templates.
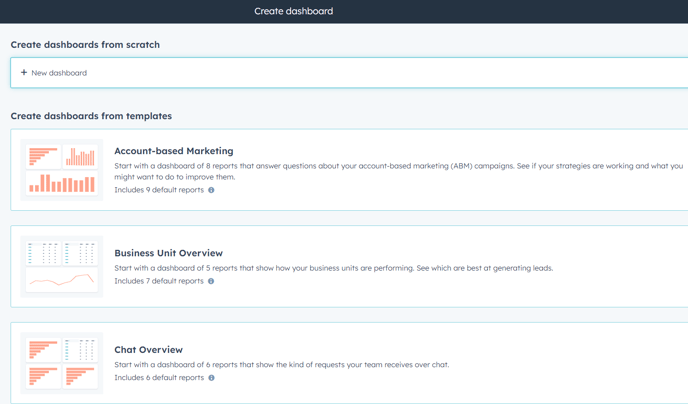
- Templates offer pre-configured dashboards tailored to specific needs, such as account-based marketing, e-commerce, or lead generation.
Exploring Dashboard Templates:
- Account-based Marketing Dashboard: Provides insights into targeted companies and associated metrics.
- Chat Dashboard: Focuses on chatbot and live chat interactions with visitors.
- E-commerce Dashboard: Tracks e-commerce performance and sales metrics.
- Marketing Channel Performance Dashboard: Analyses marketing channels, landing pages, and social media activities.
- Revenue Attribution Dashboard: Links marketing activities to revenue generation.
- Sales Manager Dashboard: Offers insights into sales team performance and deal closures.
- Service Dashboards: Monitor ticket requests, support interactions, and SLAs.
- Target Accounts Dashboard: Tracks target account engagement and management.
- Website Analytics Dashboards: Analyse website visits, engagement, and performance metrics.
Custom Reporting:
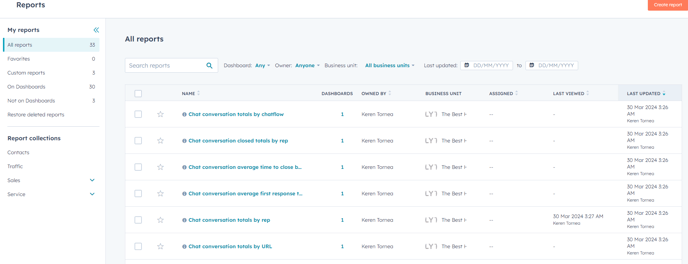
- If default dashboards do not meet specific requirements, users can create custom reports.
- Navigate to "Reports" and choose from various report types, including single object reports, custom reports, customer journey reports, attribution reports, and funnel reports.
- Utilise templates or create reports from scratch based on data sources and desired metrics.
- Add filters, customise visualisations, and save reports for future reference.
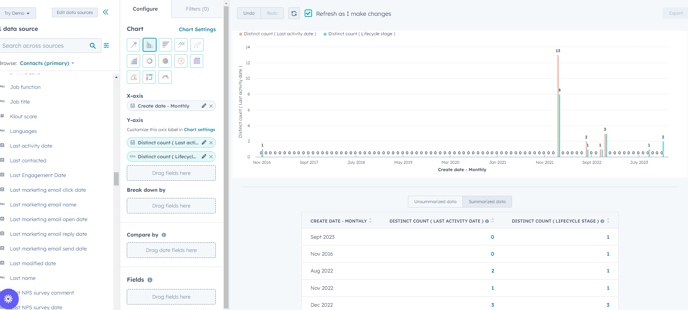
- Reports can be added to dashboards for consolidated data analysis and visualisation.
Dashboards and reporting in HubSpot offer powerful tools for monitoring, analysing, and optimising marketing, sales, and service activities. By leveraging dashboards and creating custom reports, users can gain valuable insights into key metrics, track performance, and make data-driven decisions to drive business growth and success.